I have a bit of a cold today, so I decided that instead of hopping in an icy car and driving to the office in order to spend the day drinking coffee and answering e-mail, I should stay at home, turn up the radiators, make lots of tea (with honey!) and have some fun writing code on my Raspberry Pi! Can there be a better way to ensure a speedy recovery?
By the way, if you are already a user of Dyalog APL but you haven’t got a Pi yet, you should read The APLer’s Quick-start Guide to the Raspberry Pi, which Romilly Cocking completed a few days ago. This explains what your options are for buying hardware, and how to get going with a free copy of Dyalog APL. If you don’t read it now, your cold may be over before all the bits are delivered, so hurry up!
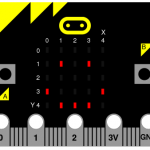
I wasn’t feeling THAT energetic this morning, so I decided to ease back into things by trying to replicate Romilly’s reaction timer, which is written in MicroPython. To begin with, I extended the microbit class that I developed for the Morse code display function with a few new methods to cover the API calls that allow me to check the state of the two buttons on each side of the micro:bit display (see the image above).
First, I added a method called is_true, which takes a MicroPython expression as an argument, evaluates it using the PyREPL function, and returns 0 or 1 depending on whether the expression returns False or True (and fails if it returns something else):
 ∇ r←is_true expr;t;z
 :Access Public
 r←1⊃t←'True' 'False'∊⊂z←PyREPL expr
 :If ~∨/t ⋄ ⎕←'True/False expected, got: ',z ⋄ ∘∘∘ ⋄ :EndIf
 ∇
This is a useful building block, which allows the simple construction of functions like was_pressed, which takes ‘a’ or ‘b’ as an argument and tells you whether the button in question has been pressed since you last asked:
∇ r←was_pressed button
 :Access Public
 r←is_true 'button_',button,'.was_pressed()'
∇
Once this is done, writing the Play function in the ReactionTimer namespace is easy, you can find the rest of the code on GitHub. The APL version is different from the MicroPython version in that – once the user presses button B and stops the game – the reaction times (in milliseconds) are returned as an integer vector. So now we can have some fun with data!
In the spirit of the micro:bit, I thought I’d produce a low tech character based chart, trying to remember the skills that were start-of-the-art when I started using APL. The AsciiChart function in the ReactionTimer namespace takes a vector of timings as the right argument, and produces a chart:
      times←ReactionTimer.Play
      times
251 305 294 415 338 298 294 251 378
      ReactionTimer.AsciiChart times
425|
400|    *
375|         *
350+
325|     *
300|  *
275|   *  **
250+ *      *
The code (which is also on GitHub) is listed below. Because this is a pure function, I used the modern dfns style of function definition rather than the old style procedural form that I’ve used for the object oriented code. The function works by allocating each value to a bucket of the size defined by the variable scale. The fun part is the use of the outer product with equals (∘.=) between the list of buckets on the left (rb) and the scaled values on the right (⌊⍵÷scale) – and then using this Boolean array to index into a two-element character vector to produce the chart. The rest is scaling calculations and finally decorating with “tik marks”:
 AsciiChart←{
     scale←25 ⍝ size of each row
     tiks←4 ⍝ tik spacing
     (max min)←(⌈/ , ⌊/) ⍵ ⍝ maximum and minimum
     base←⌊min÷scale ⍝ round down to nearest scale unit
     rb←base+0,⍳⌈(max-min)÷scale ⍝ row base values
     r←' *'[1+rb∘.=⌊⍵÷scale] ⍝ our chart
     r←((≢rb)⍴'+',(tiks-1)⍴'|'),' ',r ⍝ add tiks
     r←(⍕⍪rb×scale),r ⍝ add base values
     ⊖r ⍝ low values last (humans!)
 }
Although I might be feeling better tomorrow, I expect to be back soon. I have a couple of plastic bags full of resistors, LEDs, potentiometers and cameras (yes, plural) that I have not opened yet!


 Follow