We have been spoilt with a large number of User presentations today, and although I have focused on writing more indepth about How to Save an Italian School with APL in a separate blog, I find it important to also give our blog readers a glimpse of what we also saw and heard today.
By Vibeke Ulmann #Dyalog15
We kicked off this morning with a User presentation called ‘Mining the Depths of Excel – a Case Study in Objects and Arrays – by Richard Procter from APL Borealis in Canada.
Richard also works for BCA Research in Canada, a Company who provides analysis of the global economy and publishes regular reports on their findings. BCA get their data from Bloomberg, Reuters and other sources f.ex. Excel spreadsheets, to the tune of downloading 10ths of thousands of csv’s every night. And – importantly – they keep track of everything in Excel. This further means that BCA is using a number of add-in’s to Excel.
Currently BCA is using ⎕WC to create graphs but they’re in the process of moving to using SharpPlot. But even so, users want to make their own graphs and they can do that in Excel. As a consequence many spreadsheets have to be made available in an automated fashion and Microsoft is not really supporting the com model like they did in the past.
Richard proceeded to show us how using the openXML specification of spreadsheets in combination with the Syncfusion XLsIO library allows us to work more efficiently with APL and Excel files.
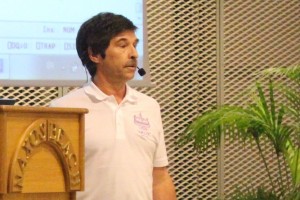
Before lunch, Paul Grosvenor, Managing Director of Optima Systems in the UK gave us a presentation called – APL Really Can make us Healthy(er)!
Those who have attended the Dyalog user meetings the last 2-3 years will have heard several presentations on COSMOS – the solution developed by Optima to allow people to explore data with no preconceptions, make data ‘understandable’, show points worth researching, and which takes a top down approach.

Paul Grosvenor on stage
The original inspiration for the design of COSMOS was 1) Neural Network and 2) Netmap – a solution which was used in the UK by the police to track phonecalls between criminals.
The COSMOS solution is fully developed in APL – has a flash FrontEnd on MiServer with an HTML5 dashboard facility.
COSMOS works with BIG DATA as well as Complex data. As an example Paul told us that one client in the US is working with 8 TeraBytes of datasets, 250 Million Patient visits each with 2-3,000 cost items per visit, and 45 Million unique patients.
The latest interest from Pharmaceutical companies springs from the fact that a drug development and trial cycle is long – typical traditional clinical trials takes 10-12 years, and then drugs need to get FDA approval, which can add a further 2-3 years. The entire process often runs into 1 Billion USD or more. Patient lives, on the other hand, are short – and new drugs are needed faster. Currently, it is estimated that around 1,000 new drugs are awaiting clinical trials approval and COSMOS can help bringing down the waiting by assiting in identifying prospects for the trials which is currently a difficult and time consuming task.
COSMOS will be used in a small gen sequencing trial which starts next month – and the aim is to reduce the clinical trial time to 2-3 years.
If you would like to know more about COSMOS, why not read the article featured in the Summer issue of our Dyalogue newsletter here: http://www.truepr.co.uk/news/dl/41/040.asp?
After lunch, it was Ray Cannon’s turn to take to the stage with a presentation named Ants, AJAX and APL. Ray is an independent APL developer and the origination of his presentation was a game programming competition, where you had to create a visualisation of a match between two species of ants.
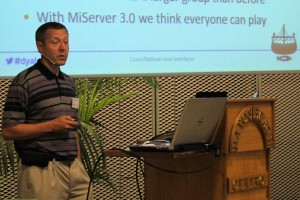
Recently Ray has replaced the use of ⎕WC with MiServer 3.0 which has vastly speeded up the user interface. The game is programmed in APL on a Linux platform on a Raspberry PI, but Linux has no frontend capability so using a TCP/IP link between the client (a web browser) and the Server (APL), he demonstrated the game in the new webfront-end. The basis for the game is that you work with 2 ant colonies, and the ant colony which brings back most food to the ant-hill wins the game. Using the new parallel features of Dyalog allowed us to see the game as 2 halves – running in parallel.
Moving swiftly on…….
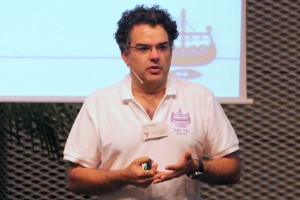
Databinding is something we have been talking a lot about this year, and after a technical introduction by John Daintree, Alexey Miroshnikov founder and MD of InfoStroy Ltd, Russia took to the stage with a presentation named Data-bound Dashboard.
Databinding is a way of sharing data between GUI elements and the logical layer of an application. InfoStroy is the developer of GAMA – Russia’s leading Global Asset Management Solution for Pension Funds, Banks, Investment Companies and other types of clients who deals with billions worth of (any currency) Investments every day.
It has always been difficult to find a way for a ‘normal’ dashboard to present data from GAMA in a meaningful way, because most dashboards cannot access the data unless they reside in a SQL database and GAMA uses a custom build column store. With the new data-binding solutions offered by Dyalog APL in combinations with WPF the problem has been solved.
Alexey told us that the development of the dashboard took 1 man week, and InfoStroy do not have to design any ‘bespoke’ dashboards anymore – as GAMA can now create visualisation of all necessary data a client wants to view. Voila! And very elegant it was too!
 MiServer UI Controls
 The Dyalog Project Project
 Data Binding – The Matrix / Waste Time with John Daintree

 Follow

 Core Performance
 Cross-platform User Interfaces
 Cross-platform File Functions