This post might be more difficult than our usual fare. You won’t find any interesting APL coding insights here—instead we’ll be focused on the tricky topic of floating-point error analysis. If that’s not your thing, feel free to skip this one! Although if you plan to use tolerated comparison in a real application, you really do need to know this stuff.
In Tolerated Comparison, Part 1, I discussed the structure of tolerant inequality with one argument fixed, and showed that
- For any real number
B, there’s another number b so that a number is tolerantly less than or equal to B if and only if it is intolerantly less than or equal to b.
- This number is equal to
B÷1-⎕CT when B<0, and B×1-⎕CT otherwise.
But these results were proven only for mathematical real numbers, which have many properties among which is the complete inability to be implemented in a silicon chip. To actually apply the technique in Dyalog APL, we must know that it works for IEEE floats like Dyalog uses (we have not implemented tolerated comparison for the decimal floating point numbers used when ⎕FR is 1287, and there are serious concerns regarding precision which might make it impossible to tolerate values efficiently).
Why should we care if a tolerated value is off by one or a few units in the last place? It’s certainly unlikely to cause widespread chaos. But we think programmers should be able to expect, for instance, that after setting i←v⍳x it is always safe to assume that v[i]=x. A language that behaves otherwise can easily cause “impossible” bugs in programs that are provably correct according to Dyalog’s specification. And finding a value that lies just on the boundary of equality with x is not as obscure an issue as it may appear. With the default value ⎕CT←1E¯14, there are at most about 180 numbers which are tolerantly equal to a typical floating-point number x. So it’s not much of a stretch to think that a program which handles a lot of similar values will eventually run into a problem with an inaccurate version of tolerated equality. And this is a really scary problem to debug—even the slightest difference in the values used would make it disappear, frustrating any efforts to track down the cause. We’ve dealt with tolerant comparison issues in the past and this kind of problem is certainly not something we want to stumble on in the future.
On to floating-point numbers. I’m afraid this is not a primer on the subject, although I can point any interested readers to the excellent What Every Computer Scientist Should Know About Floating-Point Arithmetic. In brief, Dyalog’s floating-point numbers use 64 bits to represent a particular set of real numbers chosen to cover many orders of magnitude and to satisfy some nice mathematical properties. We need to know only a surprisingly small number of things about these numbers, though—see the short list below. Here we consider only normal numbers, and not denormal numbers, which appear at extremely small magnitudes. The important result of this post is still valid for denormal numbers, which have higher tolerance for error than normal numbers, but we will not demonstrate this detail here.
Definitions: In the discussion below, q is used as a short name for the value ⎕CT. Unless stated otherwise, formulas below are to be interpreted not as floating-point calculations but as mathematical expressions—there is no rounding and all comparisons in formulas are intolerant. Evaluation order follows APL except that = is used as in mathematics: it has lower precedence and can be used multiple times in chains to show that many values are all equal to each other. The word “error” indicates absolute error, that is, the absolute distance of a computed value from some desired value. The value ulp (from “Unit in the Last Place”) is used to indicate what some might denote ULP(1), the distance from 1 to the next higher floating point number. It is equal to 2*¯52, and it is an upper bound on the error between two adjacent normal floating-point numbers divided by the smaller of their magnitudes.
We will require the following facts about floating point numbers:
- Two adjacent (normal, nonzero) floating-point numbers
a and b differ by at least 0.5×(|a)×ulp and at most (|a)×ulp.
- Consequently, the error introduced by exact rounding in a computation whose exact result is
x is at most (|x)×0.5×ulp. The operations +-×÷ are all exactly rounded.
- Sterbenz’s lemma: If
x and y are two floating-point numbers with x≤2×y and y≤2×x, then the difference x-y is exactly equal to a floating-point number. Theorem 11 in the link above is closely related, and its proof indicates how one would prove this fact.
- Given a floating-point number, the next lower or next higher number can be efficiently computed (in fact, provided the initial number is nonzero, their binary representations differ from that number by exactly 1 when considered as 64-bit integers).
We’ll need one other fact, which Dyalog APL guarantees (other APLs might not). The maximum value of ⎕CT is 2*¯32, chosen so that two 32-bit integers can’t be tolerantly equal to each other. Otherwise, integers couldn’t be compared using the typical CPU instructions, which would be a huge performance problem. The value of ulp is 2*¯52 for IEEE doubles, so ⎕CT*2 is at most ulp÷2*12. The proof below holds for ⎕CT*2 as high as ulp÷9, but not for ⎕CT*2 higher than ulp÷8.
Our task
In the following discussion, we will primarily consider the case B>0. We want to define a function tolerateLE which, given B, returns the greatest floating-point value tolerantly less than or equal to B, and to show that every value smaller than tolerateLE B is also tolerantly less than or equal to B. The last post analysed this situation on real (not floating-point) numbers, and showed that in that case tolerateLE B is equal to B÷1-q.
The case B<0 is substantially simpler to analyse, because the formula B×1-q for this case is more tractable. This case is not described fully but can be handled using the same techniques. Also not included is the case B=0. tolerateLE 0 is zero, since comparison with zero is already intolerant.
Error analysis: B÷1-q
(This section isn’t necessary for our proof. But it’s useful to see why the obvious formula isn’t good enough, and serves as a nice warmup before the more difficult computations later.)
When we compute B÷1-q on a computer, how does that differ from the result of computing B÷1-q using the mathematician’s technique of not actually computing it? There are two operations here, and each is subject to floating-point rounding afterwards. To compute the final error we must use an alternating procedure: for each operation, first find the greatest error that could happen if the operation was computed exactly, based on the error in its arguments. Then add another error term for rounding, which is based on the size of the operation’s result.
It’s helpful to know first how inverting a number close to 1 affects its error. Suppose x is such a number, and it has a maximum error x×r. We’ll get the largest possible error by comparing y÷x×1-r to the exact value y÷x (you can verify this by re-doing the calculation below using 1+r instead). The error is
err = | (y÷x) - y÷x×1-r
    = (y÷x) × | 1 - ÷1-r
    = (y÷x) × | r÷1-r
Assuming r<0.5, which will be wildly conservative for our uses, we know that (1-r)>0.5 and hence (÷1-r)<2. So if the absolute error in x is at most x×r, then the absolute error in y÷x (assuming y is exact, and before any rounding) is at most:
err < (y÷x) × 2×r
Now we can figure out the error when evaluating B÷1-q. At each step the rounding error is at most 0.5×ulp times the current value.
⍝computation     error before rounding     error after rounding
1-q              0                         (1-q)×0.5×ulp
B÷1-q            (B÷1-q) × 2×0.5×ulp       (B÷1-q)×1.5×ulp
The actual upper bound on error has a coefficient substantially less than 1.5, since the error estimate for B÷1-q was very conservative. But the important thing is that it’s definitely greater than 1. The value we compute could be one of the two closest to B÷1-q, but it could also be further out. Obviously we can’t guarantee this is the exact value that tolerateLE B should return. But what kind of bounds can we set on that value, anyway?
Evaluating tolerant inequality
The last post showed that, when B>0, a value a is tolerantly less than or equal to B if and only if it is exactly less than or equal to B÷1-q. But that was based on perfectly accurate real numbers. What actually happens around this value for IEEE floats? Let’s say B is some positive floating-point number and at is the exact value of B÷1-q (which might not be a floating-point number). Then suppose a is another floating-point number, and define e (another possibly-non-floating-point number) so that a = at+e. What is the result of evaluating the tolerant less-than formula below?
(a-B) ≤ q × 0⌈a⌈-B
The left-hand side turns out to be very easy to analyse due to Sterbenz’s lemma, which states that if x and y are two floating-point numbers with x≤2×y and y≤2×x, then the difference x-y is exactly equal to a floating-point number, meaning that it will not be rounded at all when it is computed. It’s easy to show that if a>2×B then a is tolerantly greater than B, and that if B>2×a then a is tolerantly less than or equal to B. So in the interesting case, where a is close to B, we know that the following chain of equalities holds exactly:
a-B = e + at-B
    = e + (B÷1-q)-B
    = e + B×(÷1-q)-1
    = e + B×q÷1-q
Now what about the right-hand side? Because B>0 and (by our simplifying assumption in the previous paragraph) a≥B÷2, a is the largest of the three numbers in 0⌈a⌈-B. Floating-point maximum is always exact (since it’s equal to one of its arguments), so the right-hand side simplifies to q×a. This expression does end up rounding. Its value before rounding can be expressed in terms of a-B and e:
q×a = (q×at) + q×e
    = (B×q÷1-q) + q×e
    = (e + B×q÷1-q) - (e - q×e)
    = (a-B) - e×1-q
It’s very helpful here to know that a-B is exactly a floating-point number! q×a will round to a value that is smaller than a-B (thus making the tolerant inequality a≤B come out false) when it is closer to the next-smallest floating-point number than to a-B (if it is halfway between, it could round either way depending on the last bit of a-B). This happens as long as e×1-q is larger than half the distance to that predecessor. The floating-point format guarantees that, as long as a-B is a normal number, this distance is between 0.25×ulp×a-B and 0.5×ulp×a-B, where ulp is the difference between 1 and the next floating-point number. Consequently, if e is less than 0.25×ulp×a-B, we are sure that a will be found tolerantly less than or equal to B, and if e is greater than 0.5×ulp×a-B, it won’t be. If it falls in that range, we can’t be sure.
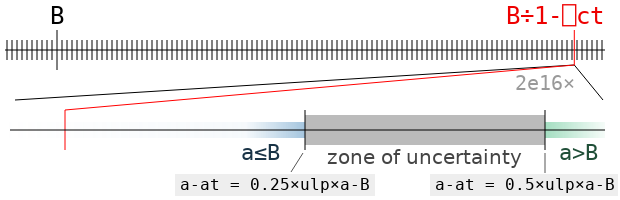
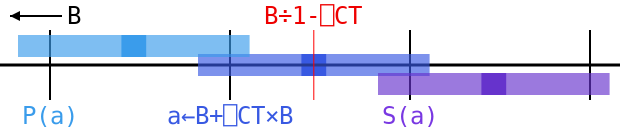
The zone of uncertainty for the value B←2*÷5 is illustrated above. It contains all the values of a for which we can’t say for sure whether a is tolerantly less than or equal to B, or greater, without actually doing the computation and rounding (that is, the result will depend on specifics of the floating-point format and not just ulp). It’s very small! It will almost never contain an actual floating point value (one of the black ticks), but it could.
If there isn’t a floating point number in the zone of uncertainty, then tolerateLE B has to be the first floating point number to its left. But if there is one, say c, then the value depends on whether c is tolerantly less than or equal to B: if it is, then c = tolerateLE B. If not, then that obviously can’t be the case, and tolerateLE B is again the nearest floating point value to the left of the zone of uncertainty.
Error analysis: B+q×B
How can we compute B÷1-q more accurately than our first try? One good way of working with the expression ÷1-x when x is between 0 and 1 is to use its well-known expansion as in infinite polynomial. A mathematically-inclined APLer (who prefers ⎕IO←0) might write
(÷1-x) = +/x*⍳∞
where the right-hand side represents the infinite series 1+x+x²+x³+…. One fact that seems more obvious when thinking about the series than about the reciprocal is that, defining z←÷1-x, we know z = 1+x×z. So similarly,
(B÷1-q) = B+q×B÷1-q
But it turns out to be much easier than that! The difference between 1 and ÷1-q is fairly close to q. So if we replace ÷1-q by 1, then we end up off by about B×q×q. Knowing that q*2 is much smaller than ulp, we see that this difference is miniscule compared to B. So why don’t we try the expression B+q×B?
The error in using B instead of B÷1-q is
(|B - B÷1-q) = |B × 1-÷1-q
             = |B × ((1-q)-1)÷1-q
             = B × q÷1-q
Multiplying by q, the absolute error of q×B is q×B × q÷1-q, which, knowing that (÷1-q)<2, is less than B × 2×q*2, and consequently less than, say, B×0.05×ulp.
⍝computation   relative to    err before rounding   err after rounding
q×B            q×B÷1-q        B×0.05×ulp            B×(0.05+q)×ulp
B+q×B          B÷1-q          B×0.06×ulp
That’s pretty close: the unrounded error is substantially less than the error that will be introduced by the final rounding (about B×0.5×ulp). Chances are, it’s the closest floating point number to B÷1-q. But it could wind up on either side of that value, so we will need to perform a final adjustment to obtain tolerateLE B.
Note that the new formula B+q×B is very similar to the formula B×1-q which is used when B is negative. In fact, calculating the latter value with the expression B+q×-B will also have a very low error. That means we can use B+q×|B for both cases! However, we will still need to distinguish between them when testing whether the value that we get is actually tolerantly less than or equal to B.
Polishing up
After we calculate a←B+q×B, we still don’t know which way a≤B will go. There’s just too much error to make sure it falls on one side or the other of the critical band. But we do know about the numbers just next to it: a value adjacent to a must be separated from the unrounded value of B+q×B by at least 0.25×B×(1+q)×ulp, or else we would have rounded a towards it. That unrounded value differs from the true value B÷1-q by only 0.06×B×ulp at most, so we know that these neighbors are at least ((0.25×1+q)-0.06)×B×ulp or (rounding down some) 0.15×B×ulp from at. But that’s way outside of the zone of uncertainty, which goes out only to 0.5×ulp×a-B, since a-B is somewhere around q×B.
So we know that the predecessor to a must be tolerantly less than or equal to B, and its sucessor must not be. That leaves us with only two possibilities: either a is tolerantly less than or equal to B, in which case it is the largest floating-point number with this property, or it isn’t, in which case its predecessor is that number. In the diagram above, we can see that the range for a is a little bigger than the gap between ticks, but it’s small enough that the ranges for its predecessor P(a) and successor S(a) don’t overlap with B÷1-⎕CT or the invisibly small zone of uncertainty to its right. In this case a rounds left, so a = tolerateLE B, but if it rounded right, then we would have (P(a)) = tolerateLE B.
So that’s the algorithm! Just compute B+q×|B, and compare to see if it is tolerantly less than or equal to B. If it is, return it, and otherwise, return its predecessor, the next floating point number in the direction of negative infinity. We also add checks to the Dyalog interpreter’s debug mode to make sure the number returned is actually tolerantly less than or equal to B, and that the next larger one isn’t.
APL model
The following code implements the ideas above in APL. Note that it can give a domain error for numbers near the edges of the floating-point range; Dyalog’s internal C implementation has checks to handle these cases properly. adjFP does some messy work with the binary representation of a floating-point value in order to add or subtract one from the integer it represents. Once that’s out of the way, tolerated inequalities are very simple!
⍝ Return the next smaller floating-point number if ⍺ is ¯1, or the
⍝ next larger if ⍺ is 1 (default).
⍝ Not valid if ⍵=0.
adjFP ← {
  ⍺←1 ⋄ x←(⍺≥0)≠⍵≥0
  bo←,∘⌽(8 8∘⍴)⍣(~⊃83 ⎕DR 256) ⍝ Order bits little-endian (self-inverse)
  ⊃645⎕DR bo (⊢≠¯1↓1,(∧\x≠⊢)) bo 11⎕DR ⊃0 645⎕DR ⍵
}

⍝ Tolerate the right-hand side of an inequality.
⍝ tolerateLE increases its argument while tolerantGE decreases it.
⍝ tolerantEQ returns the smallest and largest values equal to its argument.
tolerateLE ← { ¯1 adjFP⍣(t>⍵)⊢ t←⍵+⎕ct×|⍵ }
tolerateGE ← -∘tolerateLE∘-
tolerateEQ ← tolerateGE , tolerateLE
We can see below that tolerateEQ returns values which are tolerantly equal to the original argument, but which are adjacent to other values that aren’t.
      (⊢=tolerateEQ) 2*÷5
1 1
      (⊢=¯1 1 adjFP¨ tolerateEQ) 2*÷5
0 0
Of course, using tolerateEQ followed by intolerant comparison won’t speed anything up in version 17.0: that’s already been done!


 Follow